WTI is trading at $89.45, down 3.7%, and the tape has the feel of risk premium being pulled out faster than fresh demand can rebuild. This wti crude oil analysis starts with one simple fact: crude is the loudest mover on the board while stocks are firm, the dollar is softer, and volatility is falling. That combination matters. It says the drop is not only about a bad candle on the oil chart. It is about positioning, geopolitics, and liquidity all hitting the same side of the market.
The current live snapshot shows WTI crude oil at $89.45, gold at $4,242.20, the S&P 500 near 7,666, DXY at 101.78, and Bitcoin up 3.7% near $86,816. The U.S. 10-year yield is still elevated at 5.174%, but it is lower on the session, while VIX is down 5.2% at 15.53. That is a risk-on backdrop. Crude is the exception, and exceptions usually deserve respect.
WTI Crude Oil Analysis: Why Did WTI Drop 3.7% Today?
WTI Trades Near $89.45 as Crude Becomes the Strongest Allowed Mover
At $89.45, WTI is close enough to the $89.00 handle that every short-term trader on the screen can see the same downside magnet. A 3.7% intraday drop in a major commodity is not minor noise. It forces hedgers to adjust, it squeezes late longs, and it invites momentum sellers who were waiting for proof that the geopolitical bid was fading.
I track crude differently from indices because oil can reprice violently when headlines hit. My general observation after years watching these moves is that oil rarely gives clean, polite pullbacks when geopolitical premium is involved. It tends to gap, flush, rebalance, and only then decide whether real buyers are waiting underneath.
That is why the current decline needs to be viewed through liquidity first, not through a basic moving average lens. Traders looking for broader context can compare this setup with prior WTI liquidity analysis around the $92 area, where the same type of round-number behavior shaped the next move.
Ceasefire Headlines Reduce Immediate Middle East Risk Premium
The main driver is the change in geopolitical pricing. Reports around renewed ceasefire proposals in the Middle East reduced the perceived chance of an immediate supply shock. A Benzinga report carried by TradingView noted that equity futures gained as investors reacted to headlines about Iran receiving a U.S. proposal to restore a ceasefire. That kind of headline does not guarantee peace, and it does not remove structural supply risk. It does change what traders are willing to pay for immediate protection.
Oil trades on barrels, inventories, demand, and refining margins, but when the Middle East is involved, the market also prices tail risk. Today, that tail risk is being discounted. The result is a fast unwind from traders who bought crude for conflict premium rather than physical tightness.
Risk-On Cross-Market Tone Confirms the Premium Unwind
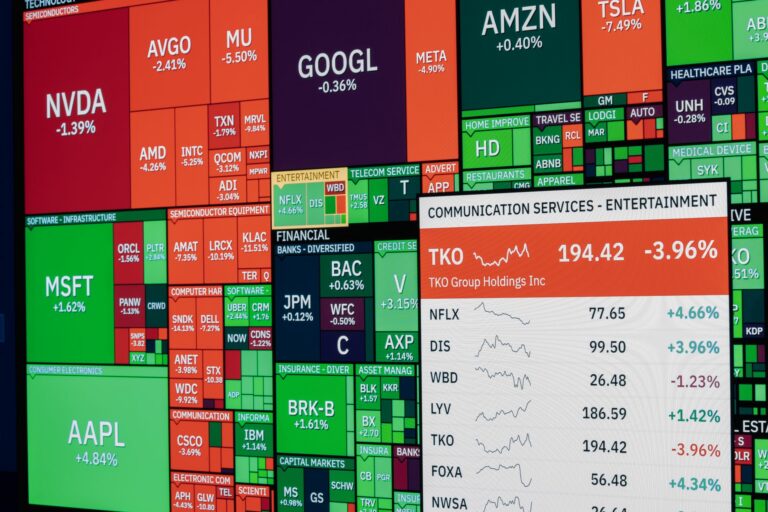
The cross-market board confirms the story. Stocks are green or flat. The dollar is down 0.3%. USD/JPY is lower by 0.6%, which also hints at some yield sensitivity cooling at the margin. Crypto is bid, with Bitcoin up 3.7% and Ethereum up 2.3%. VIX is falling.
That is not the profile of a broad panic liquidation. Crude is being repriced while risk assets hold up. In my opinion, that makes the oil move cleaner from a Smart Money Concepts perspective because it isolates the cause: premium is coming out of crude rather than capital fleeing everything. For traders who follow cross-asset flows, the broader market analysis section is worth keeping open beside the oil chart.
Is This Selloff More Than a Technical Pullback?
Geopolitical Premium Unwinds Faster Than Chart Support Forms
A normal technical pullback usually gives the chart time to build pauses, retests, and minor demand shelves. This move is sharper. Sellers have pushed WTI toward $89.45 before the market has clearly established a durable support base. That matters because support formed after a news-driven flush is weaker until price proves that buyers can absorb supply.
The danger for late bulls is assuming every dip is a bargain. In crude, a geopolitical bid can evaporate faster than chart traders expect. Once the reason for the long changes, the exit behavior changes too. Traders who bought protection may not wait for perfect technical confirmation before reducing exposure.
Middle East Ceasefire Hopes Shift Oil Market Structure
The middle east ceasefire angle is central to the current oil market structure. Before the latest headlines, WTI had room to carry a disruption premium. After the headlines, the market has to ask whether the upside tail is still worth paying for near the recent highs. That repricing alters where liquidity matters.
Instead of buyers defending every dip because supply risk is rising, the chart now has to prove demand without the same headline support. That is a different structure. It is less forgiving, especially near obvious stop clusters below round numbers.
Price Action Shows Displacement, Not Just Profit-Taking
The selling has the signature of displacement. Price did not simply drift lower. It expanded down with enough force to put the $89.00 area into play. In SMC terms, that kind of expansion often marks a change in control, at least intraday, because it leaves behind imbalances that relief rallies may revisit before deciding the next leg.
For traders refining their execution model, this is where education matters more than prediction. I would rather understand where liquidity sits and where invalidation lives than argue with the candle. The framework in our SMC trading strategies archive applies directly here: displacement first, mitigation second, continuation or failure third.
Where Is Crude Oil Liquidity Sitting Now?
Near-Term Sell-Side Liquidity Builds Around the $89.00 Handle
The nearest obvious crude oil liquidity pool is around $89.00. Round numbers in oil are magnets because discretionary traders place stops there, algorithms key off them, and breakout traders often enter as price breaks through. With spot at $89.45, that level is close enough to matter immediately.
A move into $89.00 would not automatically mean bearish continuation. It could be a stop-run followed by absorption. The key is how price trades after the raid. Fast rejection back above $89.45 would show that sellers failed to convert the sweep. Acceptance below $89.00 would tell a different story, especially if volume expands and rallies stall beneath broken intraday support.
Deeper Sweep Risk Emerges Near $88.40 if Sellers Stay in Control
Below $89.00, the next downside focus sits near $88.40. That zone is close enough to spot to be realistic on a volatile crude session, but it still requires sellers to maintain control after the first liquidity grab. I do not want to assume $88.40 prints just because $89.00 is nearby. The market has to earn that move.
What would make $88.40 more likely? A weak bounce after the $89.00 sweep, lower highs under $90.00, and failure to reclaim the displacement leg. That sequence would leave trapped longs with limited relief and give sellers a cleaner path toward the next pocket of resting orders.
Round-Number Liquidity Can Accelerate Intraday Volatility
Crude is notorious for accelerating around clean handles. The $90.00 and $89.00 levels are not magical, but they are visible. Visibility creates behavior. Stops, breakout orders, options hedging, and dealer adjustments can cluster around those prices, producing bursts that look irrational on a one-minute chart but make sense from a liquidity perspective.
That is why I do not treat the first touch of a round number as a signal by itself. I care about the reaction. Does price knife through and hold below? Does it sweep and reclaim? Does it chop long enough to build a new range? The answer decides whether the move is a liquidity grab or a broader repricing.
What Does Oil Market Structure Say After the Breakdown?
Bearish Displacement Defines the Current Intraday Bias
The current oil market structure leans bearish intraday because the strongest impulse is down. WTI at $89.45 is trading below the zone that bulls needed to defend, and sellers have momentum until the chart proves otherwise. That does not mean every rally should be shorted blindly. It means the burden of proof has shifted to buyers.
When displacement leads the session, I mark the origin, the midpoint, and the failed support area. Those levels often become decision points later. Price can rebalance part of the move without changing the larger intraday bias. Many traders confuse a bounce with a reversal, especially after a fast flush.
A $90.40 Reclaim Is Needed to Challenge Seller Control
The first serious bull marker is $90.40. A recapture of that area would challenge the immediate breakdown and force shorts to reassess whether the selloff has already swept enough downside liquidity. Until WTI gets back above that level and holds, the market remains vulnerable to another probe lower.
A clean move over $90.40 would also bring attention back to the unfilled portions of the selloff. That is where short-term sellers may begin covering and aggressive buyers may attempt a rotation toward supply. But a wick is not enough for me. I want a close, a hold, and evidence that dips are being absorbed.
Failure to Reclaim Keeps Downside Liquidity in Play
Failure beneath $90.40 keeps the $89.00 and $88.40 liquidity map active. That is the practical read. The market does not need a fresh bearish headline to keep sliding when trapped positioning is already in place. Weak rebounds can do the job.
For additional context, the prior WTI risk premium slide analysis near $92.54 is useful because it shows how quickly the narrative can change once geopolitical premium starts leaking out. Today’s move is lower in price, but the mechanics are similar.
Which WTI Order Block Matters for Bulls?
$90.80-$91.20 Supply May Cap Relief Rallies
The key wti order block I am watching sits around $90.80-$91.20. That area matters because it is above the $90.40 reclaim zone and close to where a relief rally could run into supply from traders who were trapped during the drop. It is also far enough above spot to require real buying pressure, not just a reflex bounce.
From a bullish perspective, the best response would be a reclaim of $90.40 followed by controlled trade into $90.80-$91.20, then absorption rather than rejection. That would show buyers are not only reacting to oversold conditions, they are willing to defend a higher structure.
Trapped Longs Could Use the Zone to Exit Positions
Every sharp selloff creates trapped inventory. Some longs who expected conflict premium to carry WTI higher may use the first meaningful bounce to reduce risk. That selling can appear near the same area technical traders label as supply. Different motives, same effect.
This is why relief rallies after displacement can feel heavy. Price lifts, but the order flow does not follow through. Buyers hesitate, trapped longs sell into strength, and shorts reload at better prices. A rally into $90.80-$91.20 that stalls quickly would fit that profile.
Bullish SMC Response Requires Reclaim, Close, and Hold
The bullish SMC response is simple but demanding: reclaim $90.40, close back above the broken structure, and hold that area as support. After that, WTI can test the $90.80-$91.20 supply band with a better chance of turning the session from breakdown to recovery.
I am not interested in calling a bull shift before the market shows one. Crude can bounce hard and still remain offered. The difference is whether the bounce changes behavior. Higher lows above reclaimed structure matter. A single spike does not.
WTI Crude Oil Analysis and Oil Price Forecast: Bearish Continuation vs Reclaim
Bearish Case Targets $89.00, Then $88.40 Liquidity
The bearish oil price forecast is straightforward while WTI remains below $90.40. Sellers have room to test $89.00, and a sustained break below that handle opens the door toward $88.40. The move does not need to be dramatic to matter. A controlled grind lower can be just as damaging for trapped longs as another violent candle.
Commodity commentary from Investing.com’s oil and gold forecast coverage has also kept attention on active crude and gold setups, which fits the current board where gold is higher while oil is under pressure. That split reinforces the point: safe-haven and commodity flows are not all moving together.
Bullish Case Begins Only Above the $90.40 Reclaim Zone
The bullish case begins above $90.40, not below it. A decisive recapture would suggest the downside sweep is losing momentum and that shorts may need to cover. From there, $90.80-$91.20 becomes the next test. Bulls need that zone to act less like supply and more like a transition area where sellers lose control.
A broader recovery would become more credible only after price accepts above that band. Until then, I view rallies as corrective inside a bearish intraday shift. That is a clear opinion, but it is also the only way I can stay disciplined when crude is moving this fast.
Elevated 10-Year Yield Still Limits Aggressive Risk Appetite
The U.S. 10-year yield at 5.174% is lower intraday, but it is still high enough to matter. Elevated yields can limit aggressive risk appetite, especially when traders are already reassessing growth, energy demand, and geopolitical exposure. The falling VIX and firmer equities help risk sentiment, but they do not erase the pressure that high rates can place on demand expectations.
A separate Benzinga market update highlighted equity strength as investors awaited jobs data, which matches the current cross-market tone. Stocks are not confirming an oil panic. They are confirming that crude is losing a specific bid.
For traders also tracking the metal side of the commodity board, today’s gold strength is worth comparing with our gold price analysis above $4,240. Gold holding firm while crude sells off tells me the market is separating geopolitical hedge demand from energy supply fear.
My read: WTI stays tactically bearish below $90.40, with $89.00 as the first liquidity objective and $88.40 as the deeper downside magnet. A reclaim and hold above $90.40 would force a reassessment, but the $90.80-$91.20 supply band still has to be cleared before bulls can claim real control.
FAQ
Why is WTI crude oil falling today?
WTI is falling because ceasefire headlines reduced the immediate Middle East risk premium while broader markets moved risk-on. With crude trading near $89.45, down 3.7% intraday, the move looks more like a geopolitical premium unwind than a routine technical pullback.
Where is the key downside crude oil liquidity?
Near-term crude oil liquidity is clustered around the $89.00 handle because round numbers often attract stops and breakout sellers. A sweep of that area followed by continued seller control would put the deeper liquidity zone near $88.40 into focus.
What would turn WTI bullish again?
A bullish shift needs WTI to reclaim the $90.40 area, close back above the sell-side displacement, and hold that zone as support. Until then, rallies into $90.80-$91.20 may meet supply from trapped longs exiting the breakdown rather than fresh demand.
How do Middle East ceasefire hopes affect the oil price forecast?
Ceasefire hopes can lower the risk premium embedded in crude when traders see less chance of immediate supply disruption. That does not guarantee a sustained downtrend, but it can shift the oil price forecast toward liquidity sweeps unless price quickly reclaims lost structure.
Why do stocks and bond yields matter for WTI crude oil analysis?
The cross-market read supports a risk-on tone: stocks are rising or steady as crude falls and bond yields ease intraday. The U.S. 10-year yield remains elevated at 5.174%, but its intraday decline reduces pressure on risk assets while oil loses its geopolitical bid today.
Heading into the next session, I am watching whether WTI raids $89.00 and rejects, or accepts below it and starts pulling toward $88.40. Which side of $90.40 do you think crude closes on next?
Disclaimer: This article is for educational market analysis only and is not financial advice or a recommendation to buy or sell any instrument.