
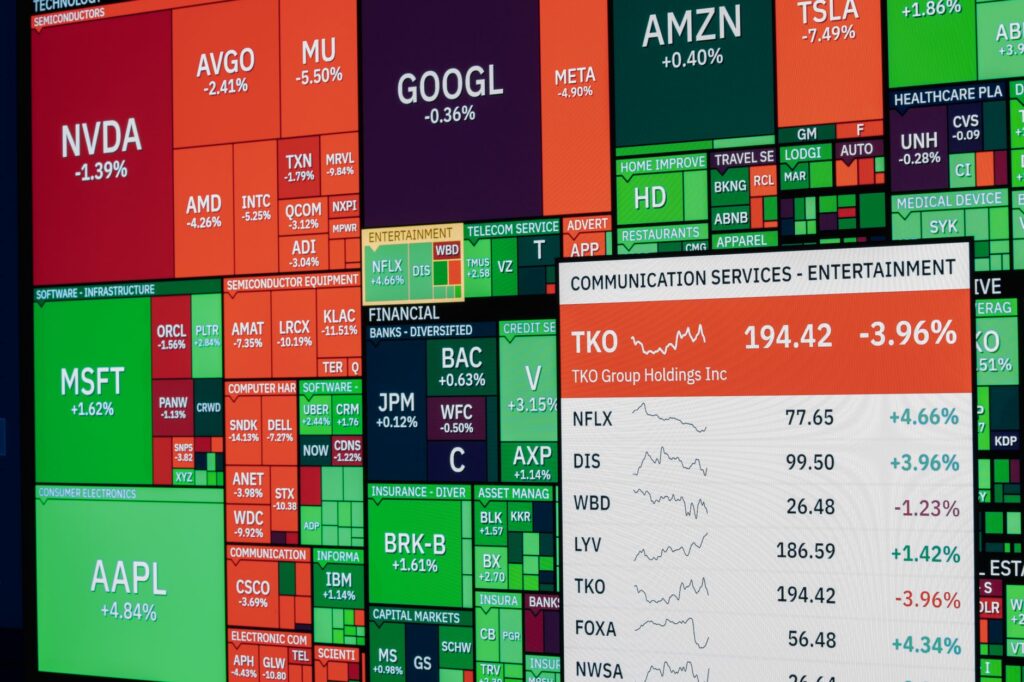
The Dow is sitting at 50,906, down 0.9%, while the Nasdaq is still green at 26,861. That split matters. My dow jones analysis starts with a simple read: sellers are pressing the value-heavy side of the market while growth is holding up better, and the pressure is clustering around the 50,900 zone.
That makes this a clean tape for serious traders. We have rising bond yields, firm crude oil, a bid in the dollar, and a mild but real risk-off market. None of those inputs exist in isolation. Together, they explain why the Dow is lagging the S&P 500 and Nasdaq while price tests a liquidity area that matters intraday.
Dow Lags As Risk-Off Flow Builds
Dow Jones trades at 50,906, down 0.9% intraday, making it the strongest allowed mover to the downside today.
The Dow Jones Industrial Average is the weak major index on the board, trading at 50,906 and down 0.9%. That is not a small relative move when the S&P 500 is down only 0.3% and the Nasdaq Composite is higher by 0.2%.
Weakness in the Dow tells me money is not simply leaving equities in a straight line. It is rotating away from the more rate-sensitive, cyclical, and dividend-linked parts of the market first. That is usually where pressure shows up when bond yields are rising and investors start demanding more compensation for holding equity risk.
I have watched this pattern many times across index futures and cash indices. When the Dow gets hit while the Nasdaq refuses to break, the market is often making a relative-value decision rather than a broad liquidation decision. It still matters for downside risk, but the quality of the selloff is different.
S&P 500 is down only 0.3% at 7,652 while Nasdaq is up 0.2% at 26,861, confirming Dow-specific underperformance.
The S&P 500 at 7,652 is holding much better than the Dow. The Nasdaq Composite at 26,861 is doing better still, up 0.2%. That relative strength confirms the current weakness is concentrated rather than uniform.
For traders tracking more market analysis, this is the kind of divergence that deserves attention. A market can look weak at the headline level, but the internal structure tells you where institutions are reducing exposure first.
There is also a narrative alignment here. A Benzinga market update also highlighted a session where Nasdaq strength contrasted with Dow weakness. That supports the read that traders are not treating all equity risk equally.
VIX at 16.42 signals a broader risk-off market rather than isolated index noise.
The VIX at 16.42, up 0.5%, is not panic. Far from it. But it does show volatility demand rising at the same time the Dow is underperforming.
That matters because isolated index weakness can be ignored when volatility is falling, credit is calm, and yields are stable. This setup is different. The VIX is firmer, the U.S. 10Y yield is at 5.304%, crude is bid, and the dollar is stronger. That combination supports the current risk-off market label.
My read: the Dow is not crashing, but it is vulnerable. The difference matters. Vulnerability means liquidity pockets below price can stay attractive until buyers prove they can absorb supply above 50,900.
Why Are Rising Bond Yields Pressuring The Dow?
The U.S. 10Y Treasury yield at 5.304% raises discount rates and pressures equity valuations.
The U.S. 10Y Treasury yield is sitting at 5.304%, up 0.2%. That is the macro anchor for this move. Higher yields raise discount rates, and higher discount rates reduce the present value of future corporate cash flows.
That sounds academic, but it shows up directly on the chart. When yields rise, equity buyers tend to become more selective. They pay less for slow growth, they demand more immediate earnings quality, and they punish names that trade like bond substitutes.
Barchart has also described stocks as pressured by rising bond yields, which fits the current tape. The Dow is getting hit harder because its composition includes more mature businesses compared with the growth-heavy Nasdaq.
Old-economy cyclicals and dividend-sensitive Dow components are hit first when yield competition increases.
The Dow has plenty of companies that investors often value on earnings durability, dividends, and economic sensitivity. Those traits are useful in some regimes, but they can become liabilities when Treasury yields are high enough to compete for capital.
When investors can get a stronger yield in fixed income, dividend equities need to work harder. A 2% or 3% dividend yield looks less compelling when the 10Y Treasury sits above 5%. That does not mean all Dow components are weak businesses. It means the hurdle rate has changed.
My opinion is straightforward: rising yields are the cleanest explanation for Dow underperformance right now. Crude and the dollar are adding pressure, but the rate market is the main driver.
Higher yields reduce the market’s willingness to pay for slower-growth cash flows.
Higher yields make patience more expensive. Investors become less willing to pay premium multiples for cash flows that grow slowly, even when those cash flows are stable.
That is why the Dow can lag even while the Nasdaq holds up. Large-cap growth can still attract buyers when earnings momentum is strong, especially if market participants believe those companies can defend margins. Slower-growth industrials, consumer names, and dividend-sensitive stocks have a tougher job when the risk-free rate is elevated.
This is also where the broader stock market today becomes more nuanced than a red or green headline. The Dow is saying one thing. The Nasdaq is saying another. The bond market is forcing the argument.
What Does 50,900 Mean For Dow Jones Liquidity?
From a smart money concepts lens, 50,900 is the active dow jones liquidity zone near current price.
With the Dow trading at 50,906, the 50,900 area is the active decision zone. From a smart money concepts lens, this is where liquidity sits close enough to current price to influence short-term behavior.
I am watching whether price accepts above that level or continues to rotate around it with weak bounces. Acceptance matters more than a single print. One push above 50,900 that immediately fades does not tell me buyers are in control. A clean hold above it, with stronger candles and follow-through, would change the tone.
This area also acts as a magnet because traders are clustered around obvious numbers. Stops, breakout orders, failed breakdown entries, and intraday hedges tend to collect near zones like this. That is why dow jones liquidity around 50,900 matters.
A clean reclaim above 50,900 would reduce immediate downside pressure and shift focus toward buy-side repricing.
A recapture of 50,900 would reduce the immediate bearish pressure. The key is quality. Price needs to move through the zone with expansion and then hold above it, rather than tagging it and slipping back under.
In smart money terms, a stronger recovery would suggest sellers failed to maintain control beneath the liquidity area. That can force short-term shorts to cover and invite buyers to reprice toward the next pockets of buy-side liquidity above the tape.
For traders who want the deeper SMC framework, the concept is similar to how an order block in trading can become relevant only after price confirms intent. The level matters, but the reaction around the level matters more.
Failure to reclaim 50,900 keeps sell-side liquidity in play below the current tape.
Failure at 50,900 keeps the downside draw active. That does not require a dramatic selloff. It simply means sellers remain comfortable defending the area, and the market may continue searching for resting liquidity below current price.
Below 50,900, the Dow can stay heavy even if the Nasdaq remains firm. That is the part many retail traders miss. Index divergence can persist longer than expected, especially when the macro driver is rates.
The practical read is simple: while price trades around 50,906, this is a live battle zone. A sustained rejection under 50,900 would keep pressure on the Dow, while a stronger reclaim would start to weaken the bearish intraday structure.
Crude Oil And Dollar Strength Add Macro Headwinds
WTI crude is up 1.1% at $91.45, keeping inflation risk elevated.
WTI crude is trading at $91.45, up 1.1%. That is not helpful for equity bulls. Higher oil prices keep inflation risk in the conversation, and inflation risk keeps the bond market sensitive.
Crude strength affects the Dow through several channels. It can support energy names, yes, but it also raises input costs, pressures consumers, and complicates the Fed path. For a price-weighted index packed with mature companies, that trade-off is rarely clean.
Gold at $4,214.80, up 0.7%, adds another clue. Defensive demand is present. Gold strength alongside a firmer dollar and higher yields is unusual enough to respect, because it shows some capital wants safety even while real-rate pressure remains high. For related context, see our gold price analysis.
Firm energy prices limit the market’s ability to price an easier Fed path.
Equity bulls generally want lower yields, softer inflation pressure, and a Fed path that looks easier over time. Firm crude makes that harder.
When oil stays bid, the market has less freedom to assume inflation will keep cooling. That matters because rate expectations feed straight into equity valuations. A Dow attempting to reclaim 50,900 has a harder job when the macro backdrop keeps pushing against multiple expansion.
This is why I do not treat 50,900 as a technical level floating in space. It sits inside a macro regime. The level is tradable, but the reaction must be judged against yields, crude, the dollar, and volatility.
DXY is up 0.3% at 101.79, creating an earnings translation headwind for multinational Dow components.
The U.S. Dollar Index is up 0.3% at 101.79. A stronger dollar can weigh on multinational Dow components because foreign revenue translates back into fewer dollars.
That headwind does not hit every company equally, but it matters at the index level. A rising dollar also tends to tighten global financial conditions. EUR/USD is down 0.4% at 1.1287, GBP/USD is down 0.3% at 1.3227, and USD/JPY is up 0.4% at 158.00. The dollar bid is broad enough to respect.
Investing.com has also discussed rising pressure from the U.S. dollar, which aligns with the current cross-asset backdrop. Dollar strength, higher yields, firm crude. That is a tough mix for the Dow.
Smart Money Concepts Setup For Stock Market Today
The key SMC question is whether price can accept back above 50,900 or continue distributing below it.
The smart money concepts setup is centered on acceptance. Price is near 50,900, and the market has to choose whether that level becomes support again or stays overhead supply.
Acceptance above the level would show buyers are willing to transact at higher prices. Continued distribution beneath it would tell me sellers are still using small rallies to reduce risk or press shorts.
That is why I care less about one candle and more about sequence. Sweep, reaction, hold. Or sweep, fail, continuation. The order of events tells the story.
Sustained trade beneath the liquidity zone favors a draw on downside sell-side liquidity.
Sustained trade beneath 50,900 keeps the draw toward sell-side liquidity alive. In plain English, the market may continue hunting the stops and resting orders below recent intraday lows.
Bitcoin at $83,670, down 1.9%, and Ethereum at $2,691, down 1.6%, also show risk appetite is soft outside equities. Crypto weakness is not the direct driver of Dow price action, but it supports the broader risk-off read.
Traders should be careful with shallow bounces here. Weak rebounds into a defended liquidity zone often look attractive right before they fail. I prefer waiting for price to show real expansion before calling a reversal.
Any upside response needs displacement, not just a shallow wick, to confirm real demand.
A meaningful upside response needs strength. A small wick above 50,900 is not enough. Buyers need to push price away from the level and defend the retest.
That is the difference between a liquidity grab and real demand. A stop-run can clear short-term orders and still fail quickly. A stronger move changes market structure by forcing sellers to react.
The best intraday Dow setups usually come after the market reveals whether a level is being accumulated or distributed. Right now, 50,900 is where that evidence should appear.
Dow Jones Analysis Bias And Key Levels
Intraday bias remains cautious while yields stay elevated and Dow underperformance persists.
The intraday bias remains cautious. The Dow is down 0.9% at 50,906, the 10Y yield is elevated at 5.304%, WTI is firm at $91.45, and the dollar is stronger at 101.79. That is enough pressure to keep me from leaning bullish without confirmation.
The Nasdaq’s relative strength is worth respecting, but it does not erase the Dow’s problem. The Dow is the weak index here. Until that changes, rallies into resistance deserve skepticism.
50,900 is the key decision zone for near-term directional confirmation.
50,900 remains the level I care about most. Above it, the Dow has room to stabilize and potentially reprice higher. Beneath it, the index remains exposed to a continued draw on sell-side orders.
- Above 50,900: buyers need follow-through and a defended retest.
- At 50,900: expect noise, stop-runs, and fast rotations.
- Below 50,900: sellers keep the cleaner short-term argument.
For broader index context, the current Dow structure also pairs well with recent coverage of Nasdaq weakness around the yield shock, even though the Nasdaq is holding up better in this snapshot.
A stronger reversal requires yield relief, dollar cooling, and a decisive Dow reclaim above the liquidity zone.
A stronger reversal needs more than a bounce. It needs the rate market to stop pressing, the dollar to cool, and the Dow to reclaim 50,900 with conviction.
Without those pieces, rallies can stay corrective. That is especially true in a tape where the Dow is lagging while volatility is firm. The market does not need panic to keep drifting lower. It only needs buyers to stay passive.
My forward-looking takeaway is this: 50,900 is the battleground, but yields are the referee. Do you think the Dow reclaims the zone, or does the next move raid lower liquidity first?
FAQ
Why is the Dow Jones underperforming today?
The Dow is underperforming because rising bond yields are pressuring old-economy cyclicals and dividend-sensitive components more than growth-heavy indexes. With the 10Y Treasury yield at 5.304%, investors are repricing cash flows, while the S&P 500 is down less and Nasdaq is slightly positive.
What is the main level in this Dow Jones analysis?
The main level is 50,900, which is the active liquidity zone from a smart money concepts perspective. The Dow is trading near 50,906, so the key issue is whether price can cleanly reclaim and hold above 50,900 or continue targeting downside liquidity.
How do rising bond yields affect the stock market today?
Rising bond yields increase discount rates, making future corporate earnings less valuable in present terms. They also make fixed-income returns more competitive versus equities. This usually pressures dividend-sensitive and cyclical sectors first, which explains why the Dow is lagging in today’s risk-off market.
Why does crude oil matter for Dow Jones liquidity?
Crude oil matters because WTI at $91.45 keeps inflation risk alive. Firm energy prices make it harder for markets to price an easier Fed path, supporting higher yields. That macro pressure can keep sellers active around Dow Jones liquidity zones like 50,900.
What would weaken the bearish Dow setup?
The bearish setup would weaken if the Dow cleanly reclaims 50,900 with strong displacement, yields cool from elevated levels, and the dollar stops rising. A softer DXY and lower 10Y yield would reduce pressure on multinational Dow earnings and valuation-sensitive components.
Disclaimer: This analysis is for educational purposes only and is not financial advice, investment advice, or a recommendation to buy or sell any market.